|
Here is a more detailed look at the Urban School insolation. Click here for data from the Moscone Convention Center solar array. Here is a San Francisco solar power map, Southwest San Francisco solar, and Victoria Street solar power. Financial considerations are discussed here Solar sense.
- Historical data is obtained from fatspaniel.
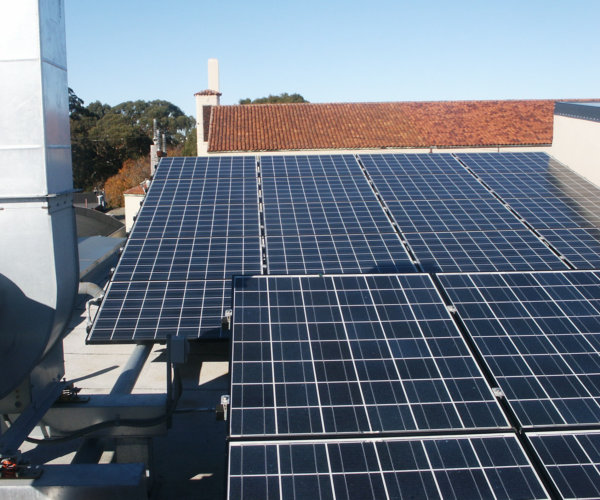
The panels at the Urban School face due south but are tilted at only 10-15 degrees from the horizontal, which is optimal for the summer solstice, but there will be a decline in kWh generated the other months of the year. Some of the modules are in shade part of the day, which also will cause a decrease in kWh generated.
- The output, kWh/year per kW sytem, and the performance ratio for the Urban School solar installation are noticeably lower than that at the Moscone Center. There has been equipment malfunction for the Urban School solar installation in April, 2006 and 2007, February, 2008, and March-June, 2010.
- Possible financial bottom line: Cost of system after rebates $60,000; 11,559 kWh x $0.12/kWh = $1,387 of electricity generated in 2006; return on investment = 2.3%. The financial bottom line may also be calculated using the figure for kWh per year per kW system. 963 kWh x $0.12/kWh = $116 of electricity generated, divided by $5,000 per kW system STC = 2.3% Data on fatspaniel indicates that this photovoltaic system generated 6.3% of the electricity used by the Urban School in 2006-7. The usual experience is that improving energy efficiency is much more cost effective than photovoltaic systems.
- As the main view indicates, this system is composed
of 72 Kyocera KC 167 Watt modules for a total of 12 kW STC. The conversion efficiency of the Kyocera solar cell is 15%.
The CEC PTC rating is 149.6 Watts per panel for a total of 10.77 kW.
The Urban website states that the system size is 10.3 kW DC, which would be 143 Watts per panel; this figure may be the manufacturer's
warranted minimum power rating.
The calculations in the above table were performed using the 12 kW STC figure. The inverter is an Xantrex PV 10 for which the electrical specifications are standby tare losses <30 watts. This is a much smaller number than the almost (-)300 watts outputs recorded at night at the Urban School.
- The performance ratio is output/input,
(AC kWh generated per kW DC STC)/(kWh insolation per square meter). This figure does not include the approximately 15% conversion efficiency of the solar cells. This is not the same as system efficiency. If you buy a solar power array 1.5 kW DC STC, you would multiply 1.5 x irradiance per square meter x the performance ratio to get an estimate of your AC power output.
|