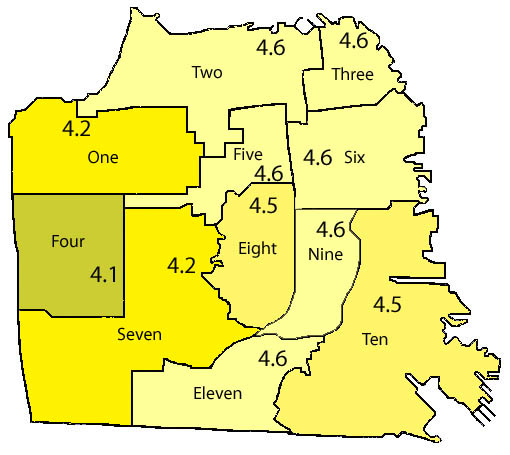
- There is a daily insolation of 4.1 or 4.2 kWh/m2/day for the west side of the city and 4.5 or 4.6 kWh/m2/day
for the east side of San Francisco, with a 12% difference between the highest and lowest districts. Data is from the SFPUC solar monitoring stations representing the city's eleven supervisorial districts. The kWh numbers in the above map are at the approximate locations of the monitoring stations, and the brightness of the colors varies with the kWh. Using this map, estimates may be made of insolation at any location in the city. There may be a 5-10% variation in insolation from year to year. Although the colors in the above map follow district lines, obviously the solar radiation does not follow these lines. Insolation in the western portions of Districts Two and Eleven, for example, is most likely lower than the figure from the monitoring stations in the eastern part of these districts. The San Francisco Department of the Environment has a Google mashup solar map; see a discussion on the sfog blog.
- The average of the 11 SFPUC solar monitoring sites is 1,627 kWh/m2/year or 4.46 kWh/m2/day. This is the same as the NREL 1991-2005 data for San Francisco (actually the airport which is 11 miles south of the Moscone Center). As is shown in the above map, monitoring sites one, four, and seven are in the western half and the remaining eight sites are in the eastern half of San Francisco. Therefore, a geographic average for San Francisco could be the average of the western and eastern halves, 1,592 kWh/m2/year or 4.36 kWh/m2/day.
- Five factors affecting output are non-standard test conditions, temperature, dirt and dust, module mismatch and wiring losses,
and DC to AC conversion losses. Use of the resulting correction factor (or performance ratio) of 0.67 is recommended in
A Guide to Photovoltaic (PV) System Design and Installation pp.8-9, published by the California Energy Commission, 2001.
The Guide also has a description of STC (standard test conditions for photovoltaic modules).
- The basic calculation for solar output is simple. The expected AC output per kW system STC is calculated by multiplying
the number for insolation per square meter x 0.67. For a 1.5 kW system STC, the annual output equals insolation per square meter x 1.5 x 0.67. The 1.5 and the 0.67 cancel each other,
so the answer is approximately equal to the insolation, 1,694 kWh/year for District 5, 1,524 kWh/year for District 7, etc.
- With full sunlight, solar irradiance is approximately 1 kW/m2. This is true not just for the tropics, but also for temperate zones in the middle of the day in spring and summer. STC conditions are defined as 1 kW/m2.
Irradiance multiplied by time in hours equals kWh of insolation. For a photovoltaic panel, conversion efficiency is kilowatts per square meter.
100% efficiency for a photovoltaic panel is 1 kW DC generated per square meter in full sunlight.
Commercially available photovoltaic panels are in the range of 10% to 20% efficiency, while 40% efficiency has been achieved in laboratories.
- A system composed of panels that are 16.7% efficient requires six square meters to generate 1 kW under standard test conditions.
This may be achieved with six 167 Watt panels, each one square meter in area. The output for a 1 kW system STC would be 1 kWh/hr. To use a formula, (size in m2) x (conversion efficiency) = (rated power in kW). E.g., (1 m2) x (0.167 efficiency) = 0.167 kW.
- a 100W panel is a 100W panel!
"Only size will be different. Less efficient only means you need a larger surface area to achieve the same amount of power." If you double the efficiency of a panel, the output per square meter will double, but the output for a given panel (e.g., 100 Watts) will remain the same, approximately 100 Watts under the test conditions being used, STC or PTC.
- Here are results for the Moscone Convention Center (district 6, zip code 94103), the Urban School of San Francisco (district 5, zip code 94117), and Victoria Street (district 7, zip code 94127). Note that SFPUC station six moved from the Moscone Center to the SFPUC future headquarters in the Civic Center in 11/06. There is another monitoring station at the Moscone Center, see San Francisco solar monitoring stations.
- Financial considerations are discussed here Solar sense.
|

