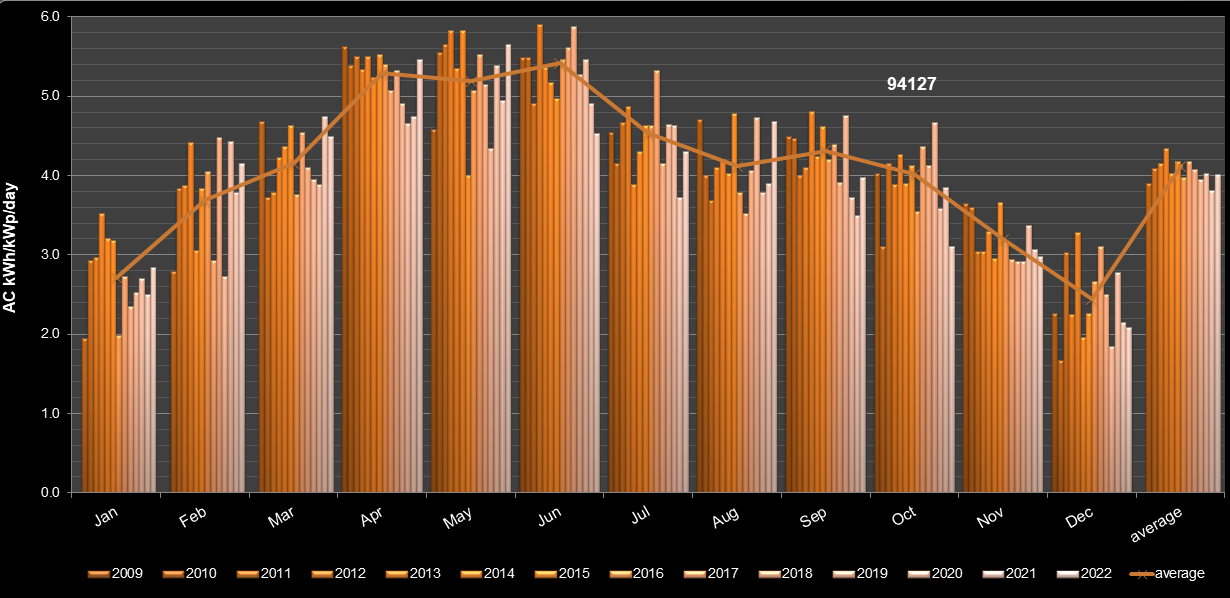
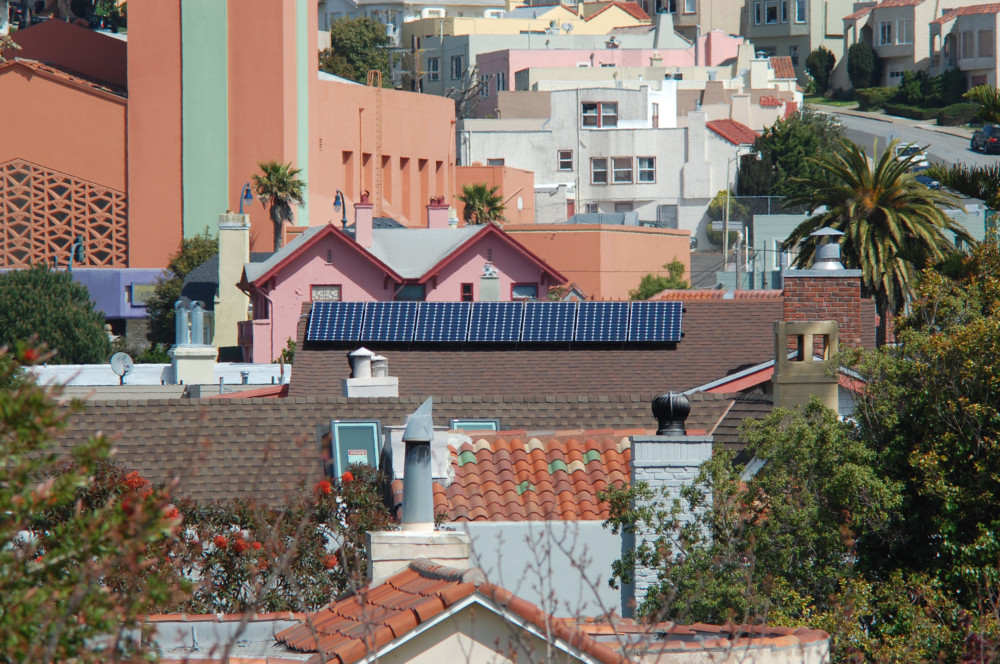
Solar power on Victoria Street, San Francisco, CA 94127 (district 7), 1.61 kWp STC DC system installed April, 2009.

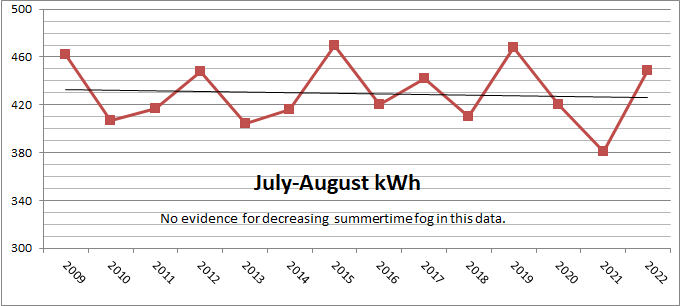
| AC produced January-June | AC produced July-December | AC produced Year | ||||||||
| Year | kWh | kWh/kWp/month | kWh/kWp/day | kWh | kWh/kWp/month | kWh/kWp/day | kWh/yr | kWh/kWp/yr | kWh/kWp/month | kWh/kWp/day |
| 2009 | 1,169 | 121 | 3.95 | |||||||
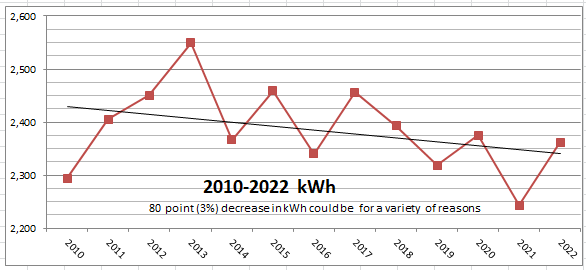
| 2010 | 1,259 | 130 | 4.32 | 1,035 | 107 | 3.49 | 2,294 | 1,425 | 119 | 3.90 |
| 2011 | 1,290 | 134 | 4.43 | 1,115 | 115 | 3.76 | 2,405 | 1,494 | 124 | 4.09 |
| 2012 | 1,352 | 140 | 4.61 | 1,099 | 114 | 3.71 | 2,451 | 1,522 | 127 | 4.16 |
| 2013 | 1,378 | 143 | 4.73 | 1,172 | 121 | 3.96 | 2,550 | 1,584 | 132 | 4.34 |
| 2014 | 1,310 | 136 | 4.50 | 1,057 | 109 | 3.57 | 2,367 | 1,470 | 123 | 4.03 |
| 2015 | 1,270 | 131 | 4.36 | 1,189 | 123 | 4.01 | 2,459 | 1,527 | 127 | 4.18 |
| 2016 | 1,254 | 130 | 4.28 | 1,086 | 112 | 3.67 | 2,340 | 1,453 | 121 | 3.97 |
| 2017 | 1,287 | 133 | 4.42 | 1,169 | 121 | 3.95 | 2,456 | 1,525 | 127 | 4.18 |
| 2018 | 1,322 | 137 | 4.54 | 1,071 | 111 | 3.62 | 2,393 | 1,486 | 124 | 4.07 |
| 2019 | 1,155 | 120 | 3.96 | 1,164 | 120 | 3.93 | 2,319 | 1,440 | 120 | 3.95 |
| 2020 | 1,294 | 134 | 4.42 | 1,081 | 112 | 3.65 | 2,375 | 1,475 | 123 | 4.04 |
| 2021 | 1,246 | 129 | 4.28 | 997 | 103 | 3.37 | 2,243 | 1,393 | 116 | 3.82 |
| 2022 | 1,318 | 136 | 4.52 | 1,044 | 108 | 3.52 | 2,362 | 1,467 | 122 | 4.02 |
| 2023 | 1,280 | 132 | 4.39 | |||||||
| average | 1,287 | 133 | 4.41 | 1,103 | 114 | 3.72 | 2,386 | 1,482 | 123 | 4.06 |
| std. dev. | 55 | 5.7 | 0.19 | 60 | 6.2 | 0.20 | 81 | 50 | 4.2 | 0.14 |
| % std. dev. | 4.3% | 5.4% | 3.4% | |||||||
| January-June vs. July-December kWh/kWp/day T-test P=0.0000001 | ||||||||||


230 Watt panels, tilt 23o, azimuth 196o, shading 2%. Note that the tilt of ~23o corresponds to the hypotenuse of a 5, 12, 13 right triangle.
Click or doubleclick on the picture to see the full-size original (3000x2000 pixels, 3MB)
